The curtain goes down. The AI magician takes a bow. The audience reaches into their pockets to call for more. They want that sizzle in their own company, their own group, their own lives. And that leads them down the hall to data scientists.
That’s when the hard reality hits.
To fill their table with the deliciousness of AI delights, they need to rethink their own backyard. They need to understand that the AI outcomes are really data outcomes. And the journey to the table goes back to the farm.
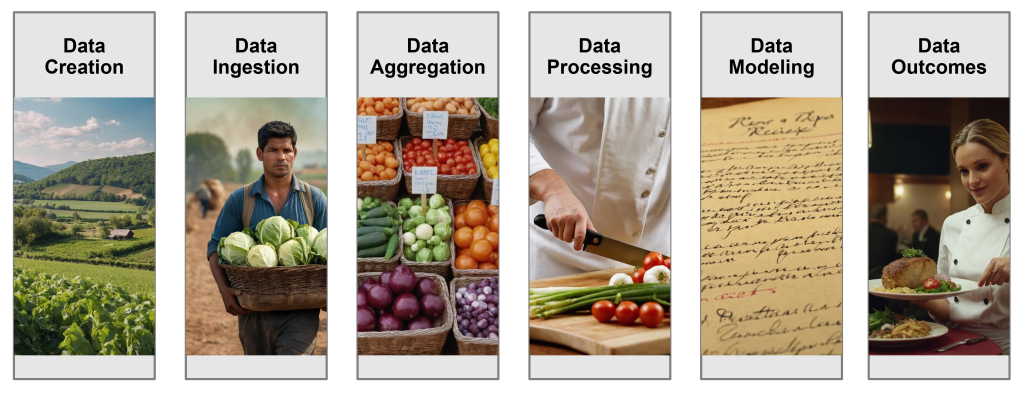
Stage 1 – Data Creation
Data can be found in neat rows and columns like a farmers field. It can also be found growing wild in the bramble. Each of these types are byproduct of how we live. Every application, human, and instrument leave a digital trail. These are the seeds that grow into useful nutrition for the ever-hungry AI algorithms.
Stage 2 – Data Ingestion
We send pickers into the field to harvest this data. The process might be accomplished by hand or by machine. Data professionals call this phase “data ingestion” because its the transportation from source. In much the same way as the combine looks like it eats the fields of wheat, rice, or corn.
Stage 3 – Data Aggregation
Farm products find their way to a key location. When they are stacked in baskets with prices, each labeled from a separate farm, we have a market. A place where data consumers can shop for what is desired on this day. This phase goes by the name of “data aggregation” since we go from many locations to a single spot.
Stage 4 – Data Processing
However, this data cannot be digested as is. Once the chef brings back the bounty, line cooks begin to process those ingredients. Chickens are broken down. Onions are chopped. Herbs are julienned. We go from raw to processed. In terms of data, this function is where tables are joined, missing cells filled in, and text files are tokenized to be indexed.
Stage 5 – Data Modeling
But what to cook? The data scientist puts on her chef’s jacket and toque. She experiments many times before the recipe is committed to paper. This is an iterative process that can take many intensive hours. The pressure mounts as hour to open the restaurant nears. Her algorithm will have to perform accurately and efficiently as the night’s diners have no patience for tasteless meals.
We often hear about “modeling with machine and deep learning”. We hear about “transformers and neural networks” in this phase. Yet, those expressions fail the most important feature: we create a mathematical means to interpret what comes in. “Data modeling” captures the play between inputs and outputs.
Stage 6 – Data Outcomes
The lights are on and patrons fill the restaurant. There will be little time to think in the kitchen. The cooks are ready with recipes and a station of mise-en-place. Except these line cooks exist only in code. They are the large language models that function as digital assistants. The recommendation engines which suggest what’s best like a proper sommelier. And predictive algorithms whispering advice like bartenders for the curious of what may come to pass.
This is the data pipeline as a farm-to-table metaphor.
The local food movement and Chef Daniel Barber.
In 2015, “Chef’s Table” showcased Chef Daniel for two reasons. His genius on the plate. His mission to change how food is grown. His effort is at the heart of the farm-to-table revolution. It reimagines how food finds its way to us. He chose to shape the supply by inviting his diners to demand better. He went back to the field to encourage a more wholesome process. To provide a missing voice to the conversation dominated by agricultural industrialists.
The lesson for the data journey from the farm-to-table movement is this: there must be systematic thinking. This thinking must occur up and down the chain. This is a kind of control plane that unifies all of the steps into one philosophy. A philosophy based on responsibility and security.
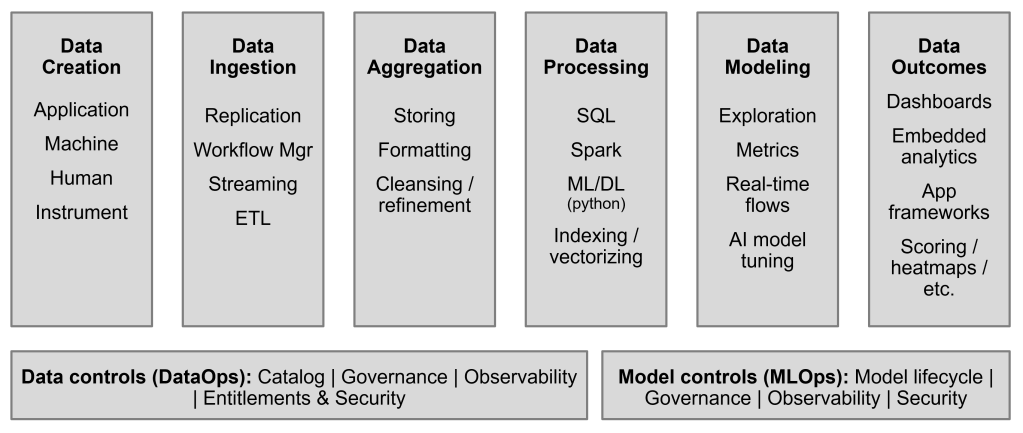
The attached diagram lists the stages of the data pipeline with more technical jargon. If you are a data professional, those notations will need no explanation. But this blog was meant to give those of us less familiar, the big idea by using poetic license.
Underneath the six boxes are two more which define the control plane for the data journey. There are parallels between the two. However, one is focused on stewardship to the data, and the other stewardship to the algorithms.
What they share is a means to drive up efficiency and drive down unintended consequences. These are the guardrails that make the process safe and sustainable.
That seems to share the ethos of Chef Daniel.
We need that kind of discipline, too, if we are to continue enjoy the magic.
